In the dynamic realm of cloud computing and containerization, keeping a vigilant eye on the health and performance of your Kubernetes (K8s) clusters is paramount. Fortunately, Grafana offers a robust and flexible solution for visualizing and monitoring this intricate system. In this article, we will delve into the configuration of Grafana to empower you with the tools and insights needed to effectively monitor your Kubernetes clusters. So grab your virtual hardhat, because we’re about to embark on a journey through the virtual infrastructure frontier!
Table of Contents
- Setting up Grafana with Prometheus Data Source
- Visualizing Kubernetes Cluster Metrics
- Configuring Alerts for Monitoring Kubernetes Cluster
- Optimizing Grafana Dashboards for K8s Cluster Insights
- Q&A
- In Retrospect
Setting up Grafana with Prometheus Data Source
Setting up Grafana with Prometheus data source is essential for visualizing Kubernetes (K8s) cluster monitoring effectively. By integrating Grafana with Prometheus, you can create custom dashboards and gain valuable insights into your Kubernetes cluster’s performance.
To configure Grafana for visualizing Kubernetes cluster monitoring, follow these steps:
- Install and configure Prometheus data source in Grafana.
- Create custom dashboards in Grafana to display Kubernetes cluster metrics such as CPU usage, memory consumption, and network traffic.
- Use Grafana alerts to receive notifications when cluster metrics exceed predefined thresholds.
- Explore Grafana plugins to enhance visualization capabilities and further customize your monitoring setup.
Visualizing Kubernetes Cluster Metrics
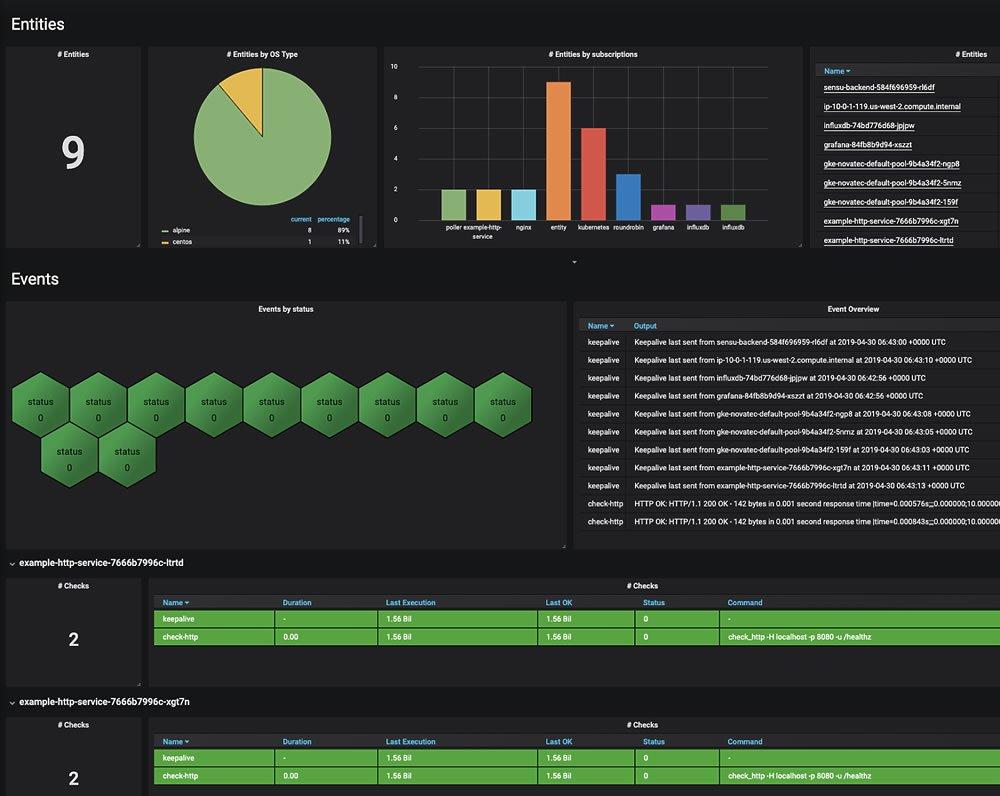
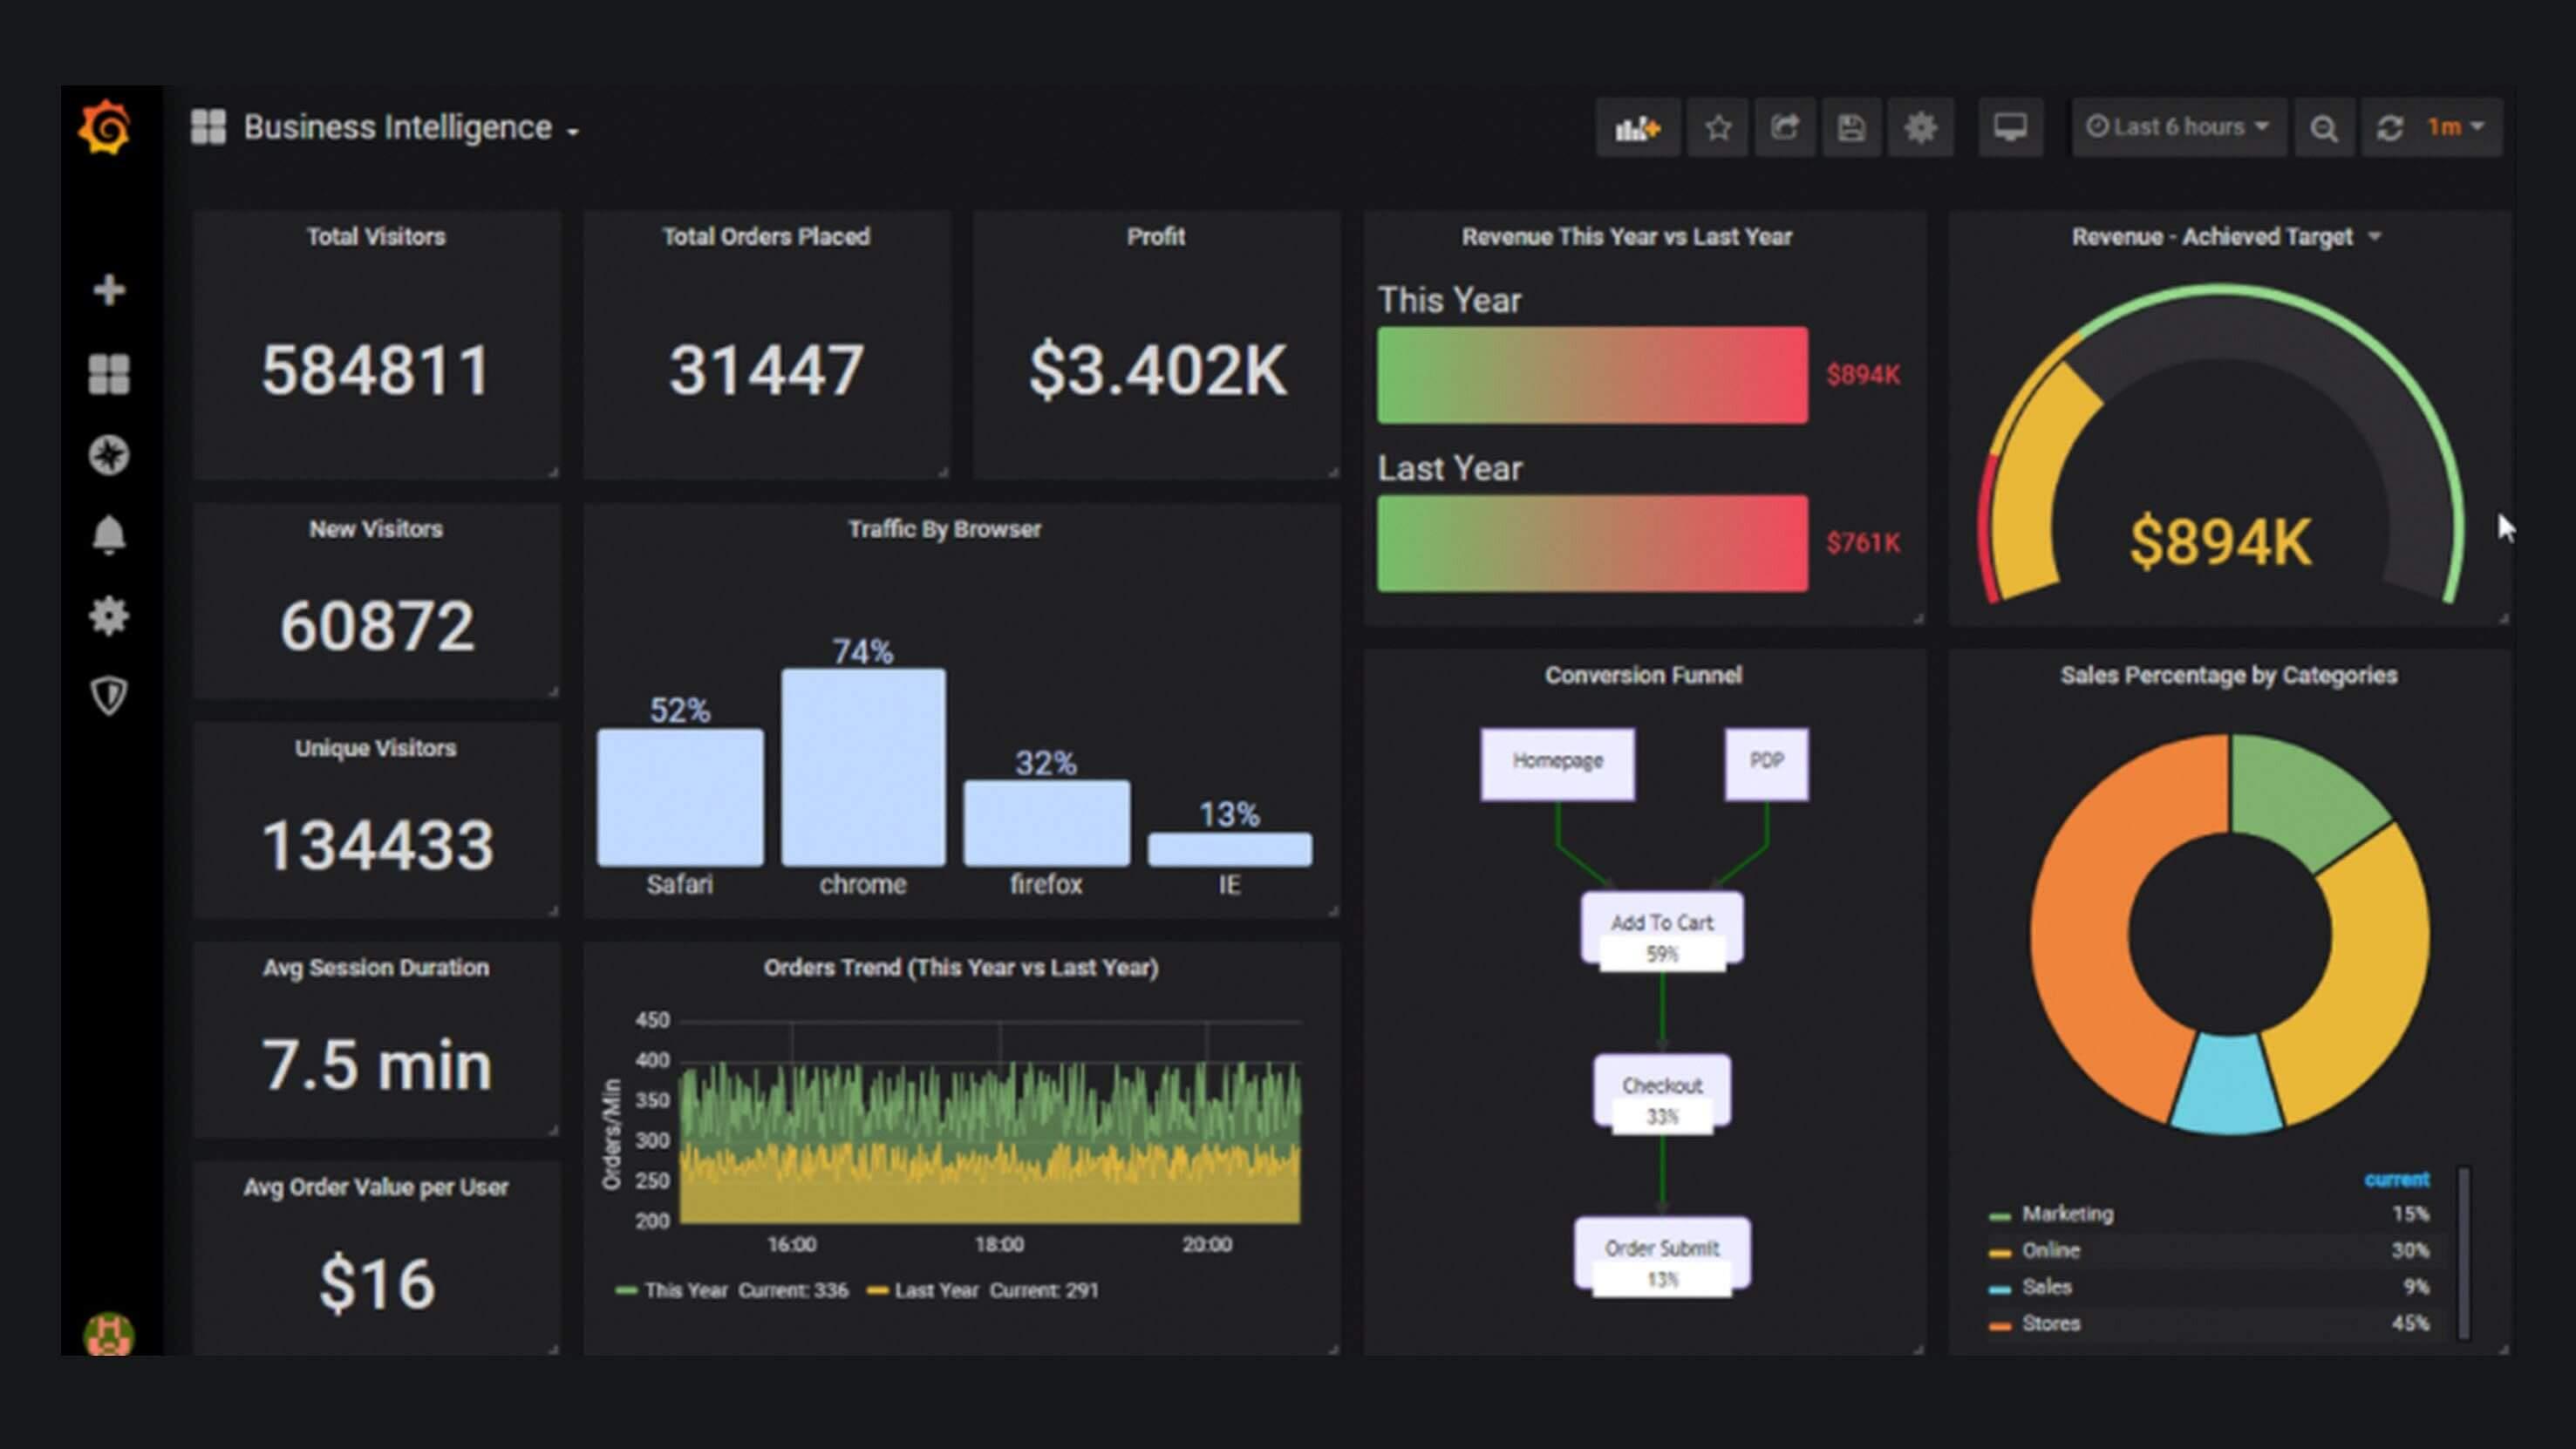
When it comes to monitoring your Kubernetes cluster, having a visual representation of your metrics can make all the difference. Grafana is a powerful tool that allows you to create beautiful dashboards to visualize your Kubernetes cluster metrics in real-time. By configuring Grafana properly, you can gain valuable insights into the health and performance of your cluster.
With Grafana, you can easily track key metrics such as CPU and memory usage, pod status, and network activity. By customizing your dashboards to display the specific metrics that matter most to your organization, you can quickly identify any potential issues and take proactive steps to optimize your cluster performance. Additionally, Grafana supports integration with Prometheus, an open-source monitoring solution commonly used in Kubernetes environments, making it easy to collect and visualize your cluster metrics seamlessly.

Configuring Alerts for Monitoring Kubernetes Cluster
When configuring alerts for monitoring a Kubernetes cluster, it is essential to set up Grafana to visualize the cluster’s performance metrics effectively. One way to do this is by utilizing Grafana’s built-in Prometheus data source, allowing you to display real-time monitoring data in a visually appealing format.
To configure alerts in Grafana for Kubernetes cluster monitoring, follow these steps:
– Install Prometheus and Grafana on your Kubernetes cluster.
- Add Prometheus as a data source in Grafana.
– Create custom dashboards to display relevant metrics such as CPU usage, memory usage, and pod status.
– Configure alert rules in Prometheus and set up notification channels to receive alerts via Slack, email, or other preferred methods.
– Monitor the cluster’s performance and health status through Grafana dashboards and respond to alerts promptly to ensure optimal system operation.
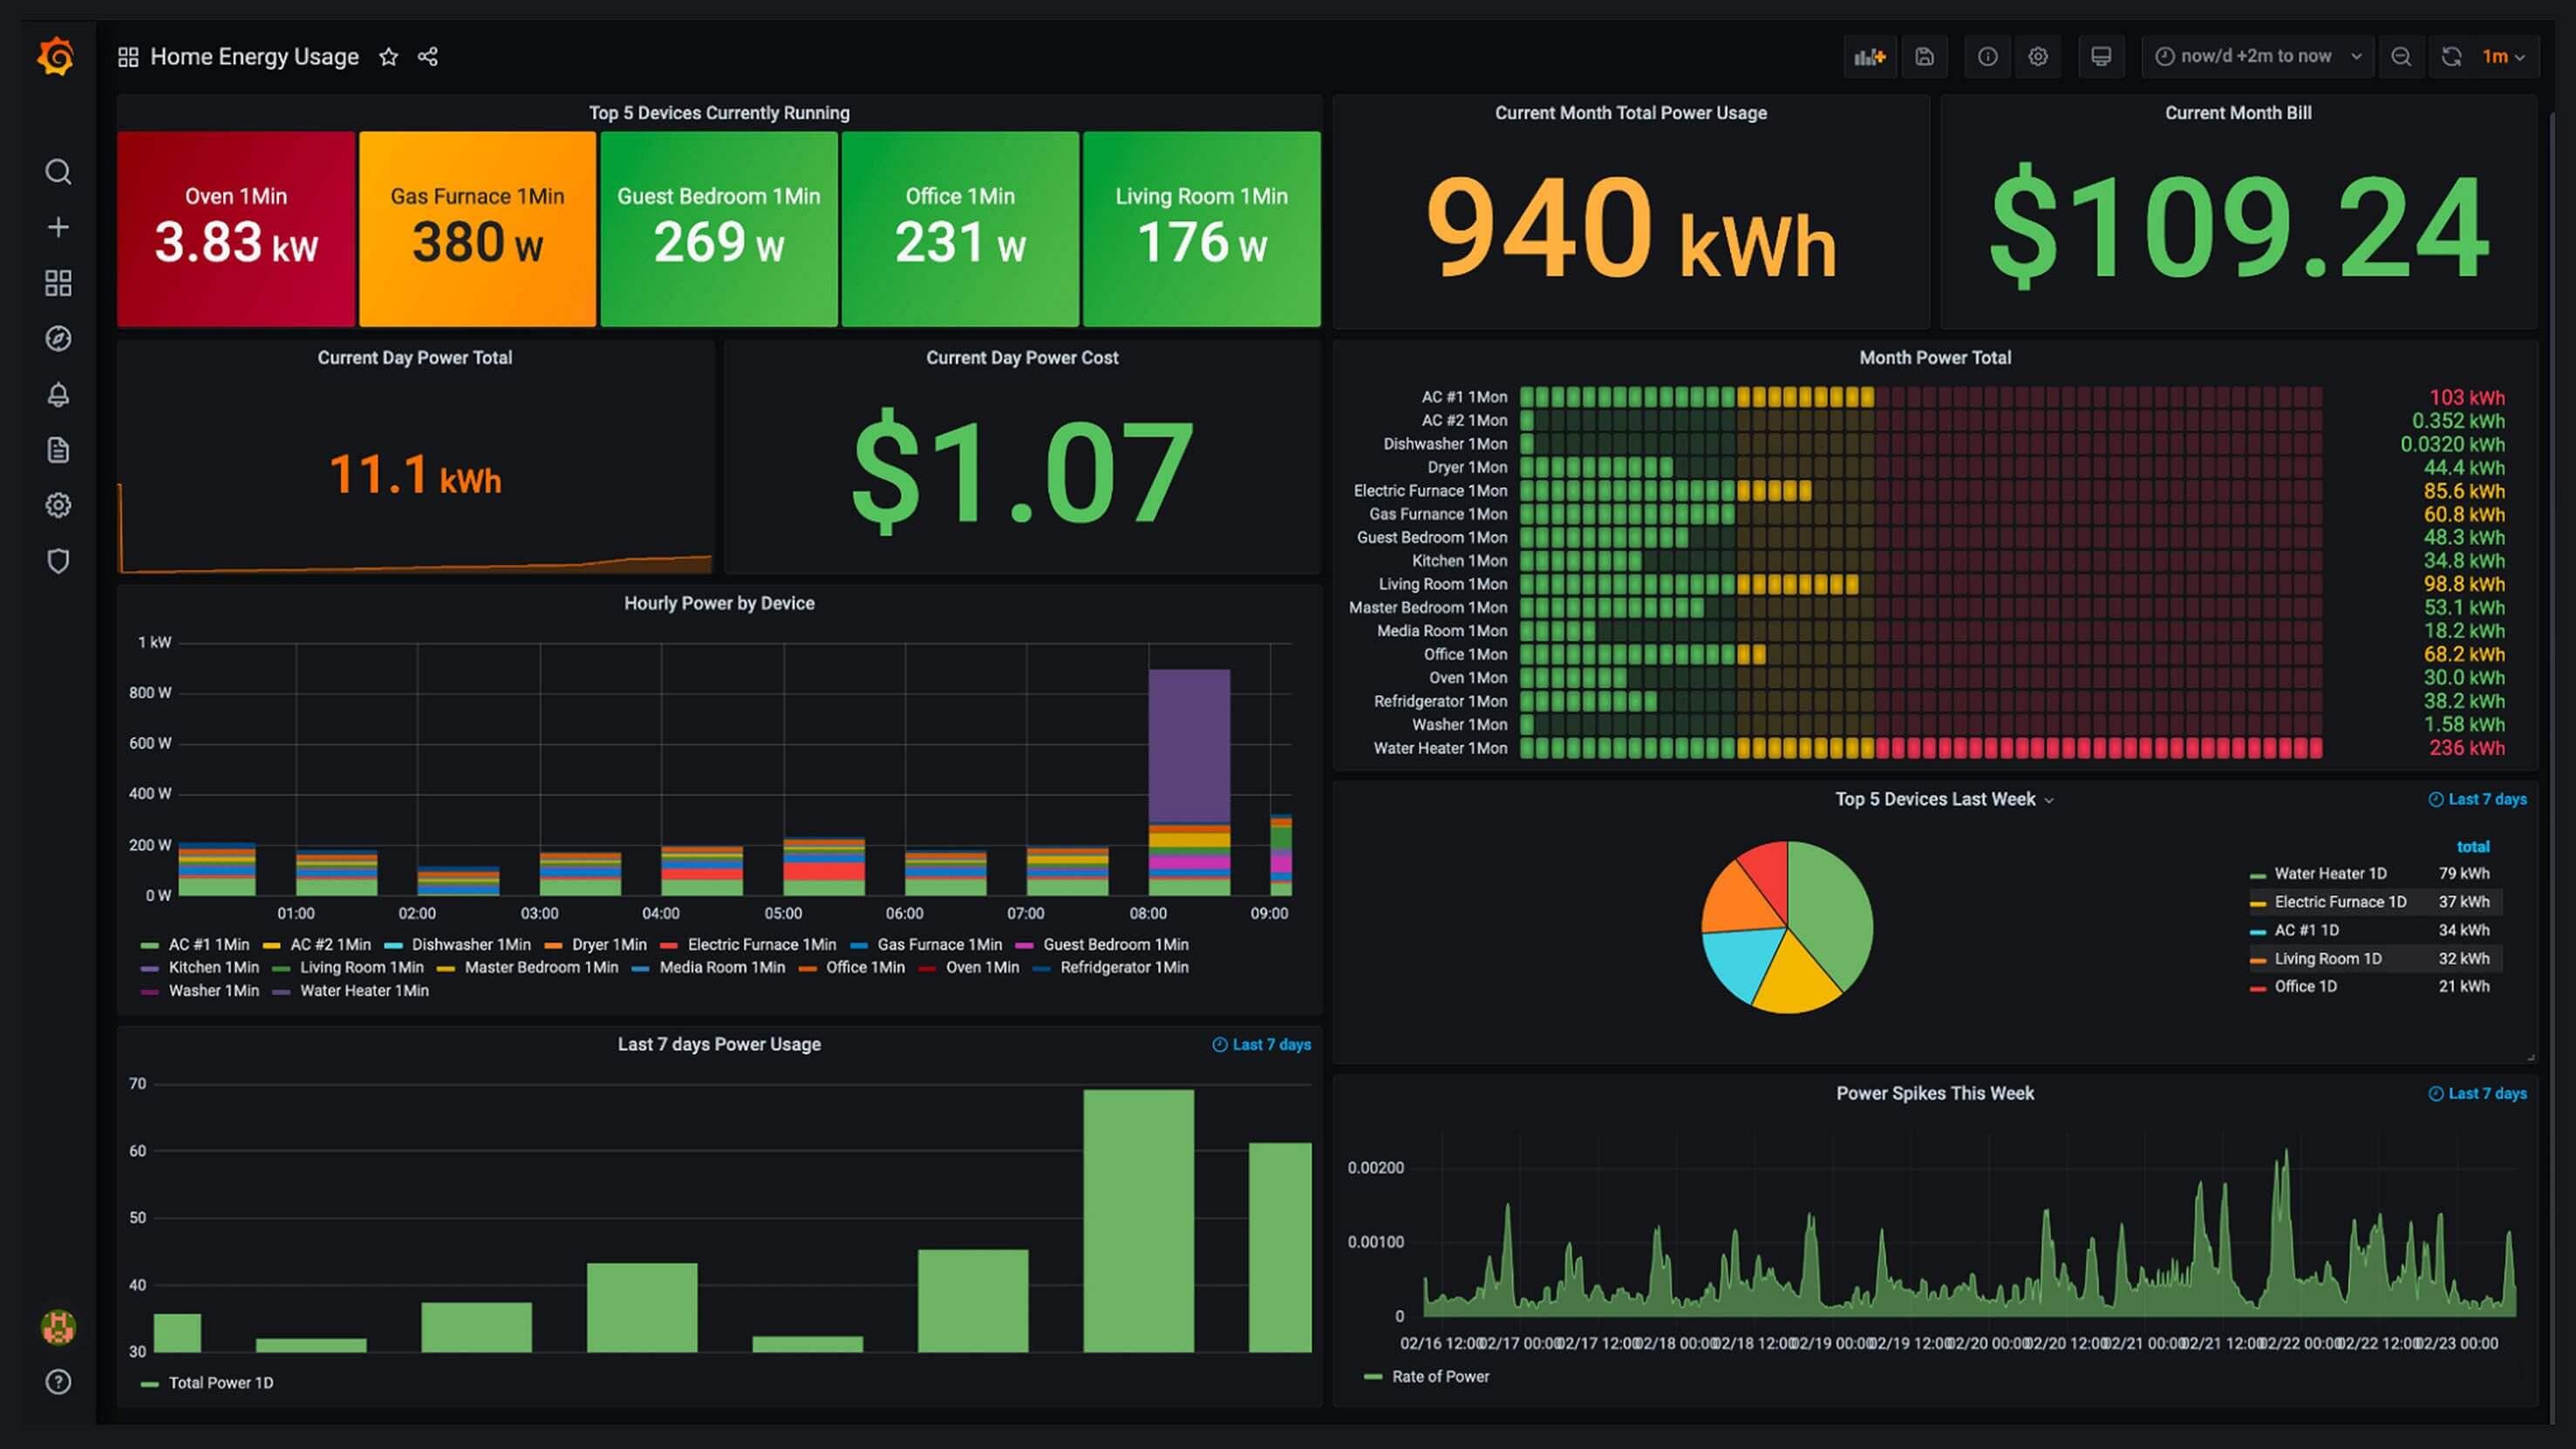
Optimizing Grafana Dashboards for K8s Cluster Insights
When configuring Grafana for visualizing Kubernetes (K8s) cluster monitoring, it’s essential to optimize your dashboards to provide valuable insights into the health and performance of your cluster. By customizing your Grafana dashboards with specific metrics and visualizations tailored to your K8s environment, you can gain a deeper understanding of how your cluster is functioning and identify any potential issues before they impact your operations.
To optimize your Grafana dashboards for K8s cluster insights, consider the following tips:
- Utilize pre-built Kubernetes dashboard templates: Take advantage of existing Grafana dashboard templates designed for Kubernetes monitoring, such as those available in the official Grafana dashboards repository.
- Organize your metrics logically: Group related metrics together on your dashboard to make it easier to identify trends and anomalies.
- Visualize key performance indicators: Use graphs, charts, and tables to display important K8s metrics such as CPU usage, memory consumption, pod status, and network traffic.
Q&A
Q: What is Grafana and why is it used for visualizing Kubernetes cluster monitoring?
A: Grafana is an open-source platform for analytics and monitoring that allows you to pull metrics from various data sources, including Kubernetes clusters, and create visualizations to better understand and monitor your system’s performance.
Q: What are the benefits of configuring Grafana for Kubernetes cluster monitoring?
A: By configuring Grafana for Kubernetes cluster monitoring, you can gain valuable insights into the health and performance of your cluster, identify potential issues or bottlenecks, and make data-driven decisions to optimize and scale your infrastructure.
Q: How can I set up Grafana to monitor my Kubernetes cluster?
A: To configure Grafana for monitoring your Kubernetes cluster, you will need to first set up data sources to pull metrics from your cluster, such as Prometheus or InfluxDB. Then, you can create dashboards in Grafana to visualize this data and monitor key metrics like CPU usage, memory usage, and network traffic.
Q: Are there any best practices to follow when configuring Grafana for Kubernetes cluster monitoring?
A: Some best practices to follow when configuring Grafana for Kubernetes cluster monitoring include setting up alerts to notify you of any issues, using labels and annotations to organize your dashboards, and regularly updating and optimizing your dashboards to ensure they provide accurate and actionable insights.
Q: How can I troubleshoot common issues when setting up Grafana for Kubernetes cluster monitoring?
A: If you encounter issues when setting up Grafana for Kubernetes cluster monitoring, you can refer to the official documentation for guidance, join community forums or Slack channels for support, or consult with colleagues or experts who have experience with similar setups. Additionally, you can use Grafana’s built-in logging and monitoring features to identify and resolve any issues that arise.
In Retrospect
configuring Grafana for visualizing Kubernetes cluster monitoring can provide valuable insights into the performance and health of your infrastructure. With the right tools and settings, you can create visually appealing dashboards that help you monitor your K8s cluster with ease. By following the steps outlined in this article, you’ll be well on your way to effectively monitoring your Kubernetes environment and making informed decisions to optimize its performance. Happy monitoring!


Neque porro quisquam est, qui dolorem ipsum quia dolor sit amet, consectetur, adipisci velit, sed quia non numquam eius modi tempora incidunt ut labore.
Quis autem vel eum iure reprehenderit qui in ea voluptate velit esse quam nihil.
Et harum quidem rerum facilis est et expedita distinctio. Nam libero tempore, cum soluta nobis est eligendi optio cumque nihil impedit quo minus id quod maxime placeat facere.